Sensor anomaly detection
Sensor monitoring is a natural setting for robust distances: most observations describe normal operation, while faults appear as unusual multivariate combinations rather than single-channel spikes.
Result at a glance
FastMCD detects the injected sensor faults with precision and recall equal to 1.000 in this example. The radial kurtosis is about 11.4, so the diagnostics also warn that Gaussian thresholds should be treated carefully.
What the data represent
The simulation creates several correlated sensor channels and injects abnormal operating points. The abnormal rows are designed to be visible in the joint sensor geometry.
Why this estimator
FastMCD is used because the normal operating regime is a single dominant cluster and faults are separated from that cluster.
Reproduce the result
python examples/use_case_sensor_anomaly.py
Output from the run
sensor anomaly use case
precision=1.000, recall=1.000, detected=35
radial_kurtosis=11.421, support=551
saved diagnostics to results/use_cases/sensor
Figures and diagnostics
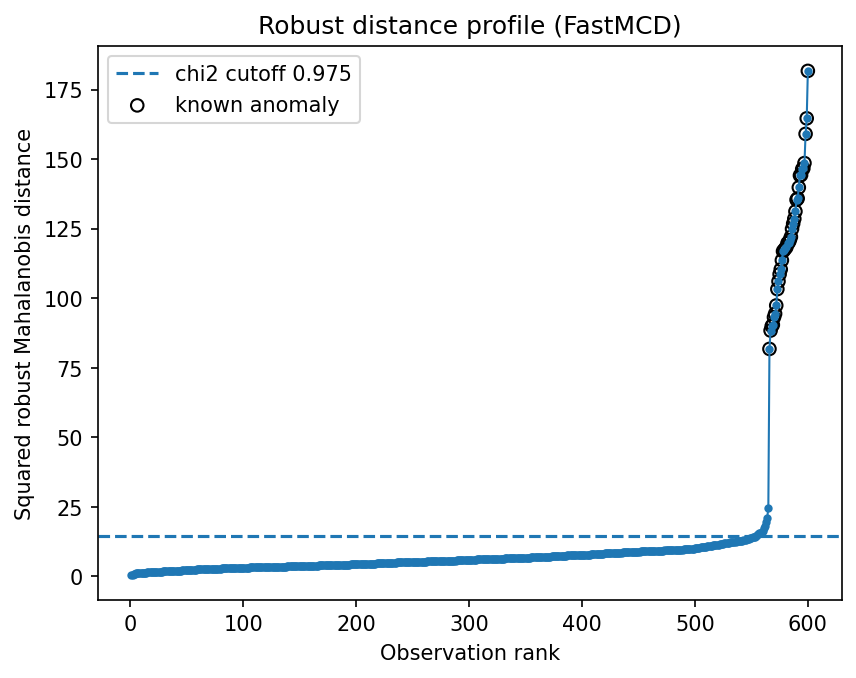
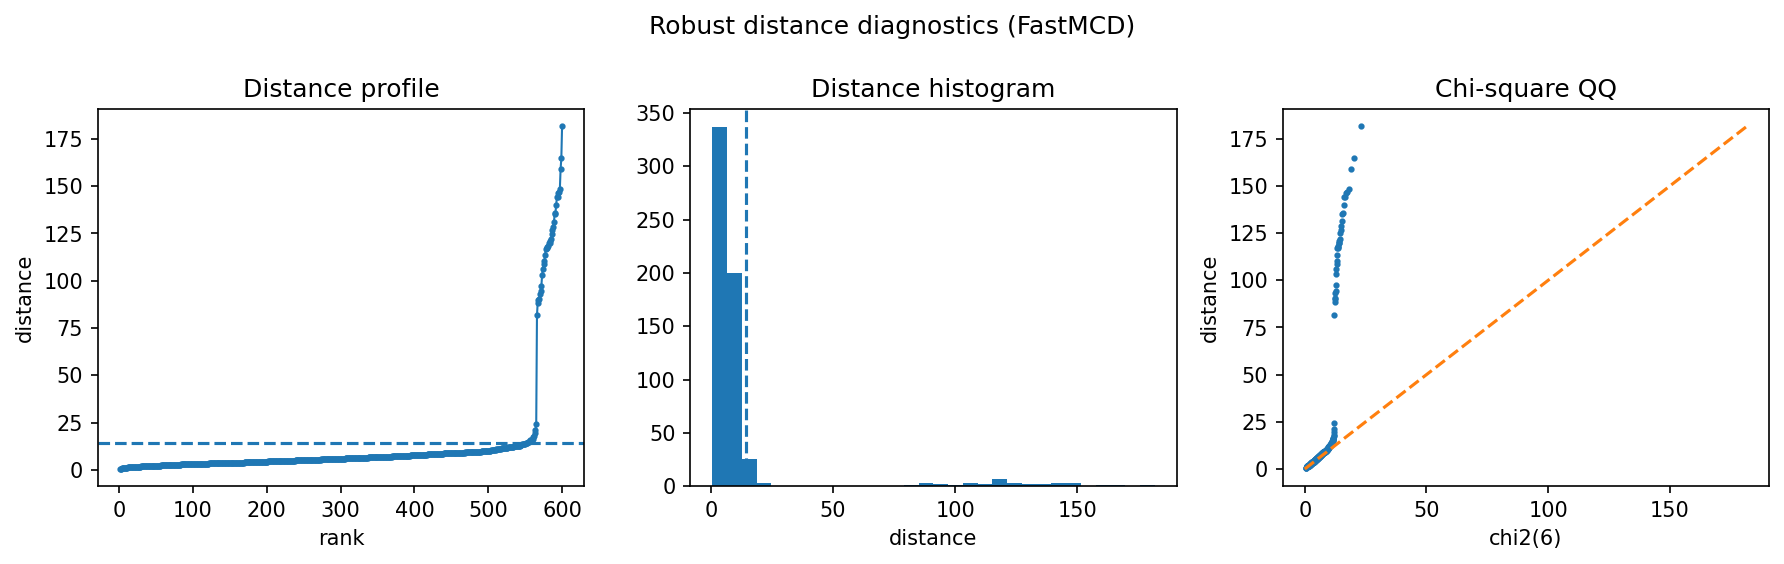
How to read the result
The distance panel is the main plot: normal observations should form a compact bulk, while faults appear above the robust threshold. If the tail is gradual rather than separated, choose a threshold from operational review capacity rather than from a theoretical quantile.
What this does not prove
In production, sensor drift and regime changes matter. Refit or recalibrate on rolling windows and compare detected anomalies with maintenance logs.