Predictive-maintenance monitoring
Predictive maintenance often starts with the same practical need: rank machine states by how unusual their multivariate sensor pattern looks.
Result at a glance
The synthetic monitoring example reaches precision and recall around 0.786. It is intentionally less perfect than the simple sensor example, which makes it a better reminder that faults may overlap with normal operating variation.
What the data represent
The simulation creates time-like machine states with correlated sensor features and injected degradation/fault periods.
Why this estimator
FastMCD or AutoRobustAnomalyDetector are reasonable first choices. The robust distance becomes a health score that can be tracked over time.
Reproduce the result
python examples/use_case_maintenance_monitoring.py
Output from the run
predictive-maintenance monitoring
precision=0.786, recall=0.786, detected=70
radial_kurtosis=1.607
saved diagnostics to results/use_cases/maintenance
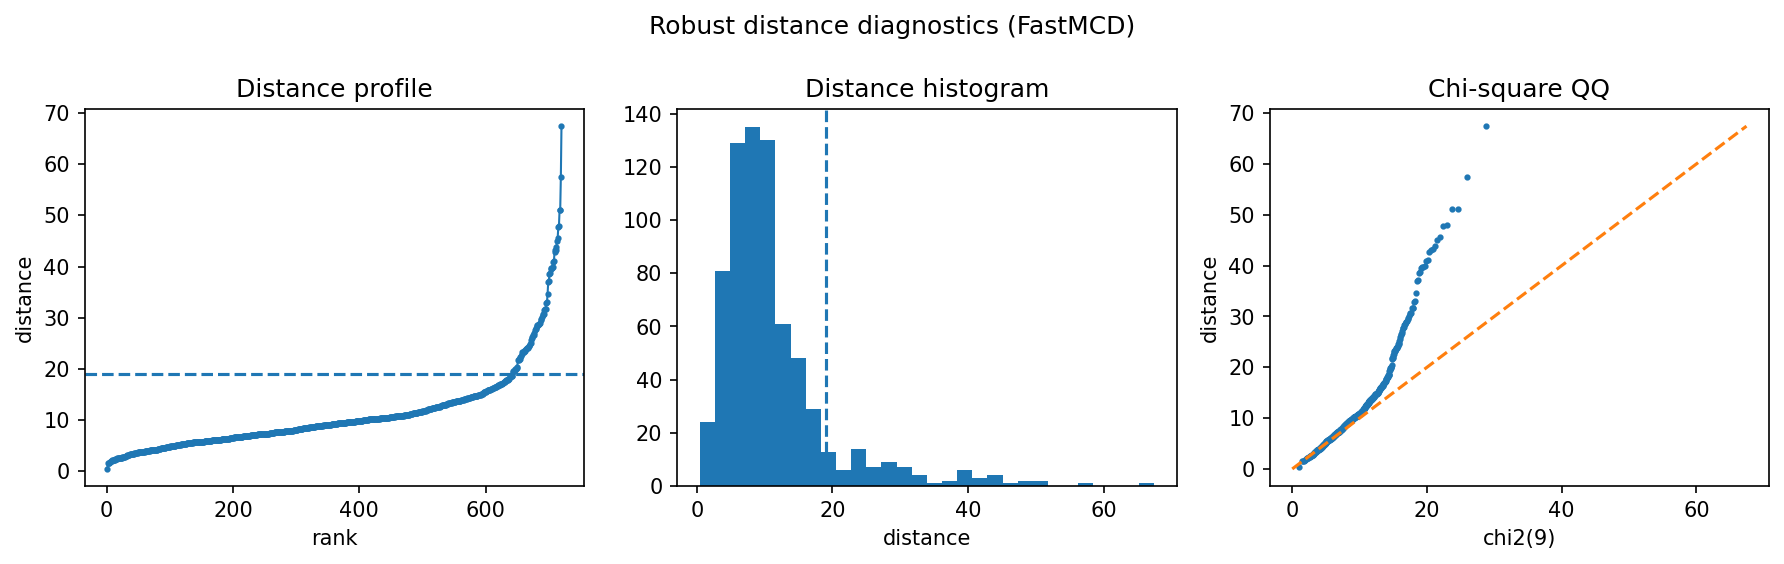
Figures and diagnostics
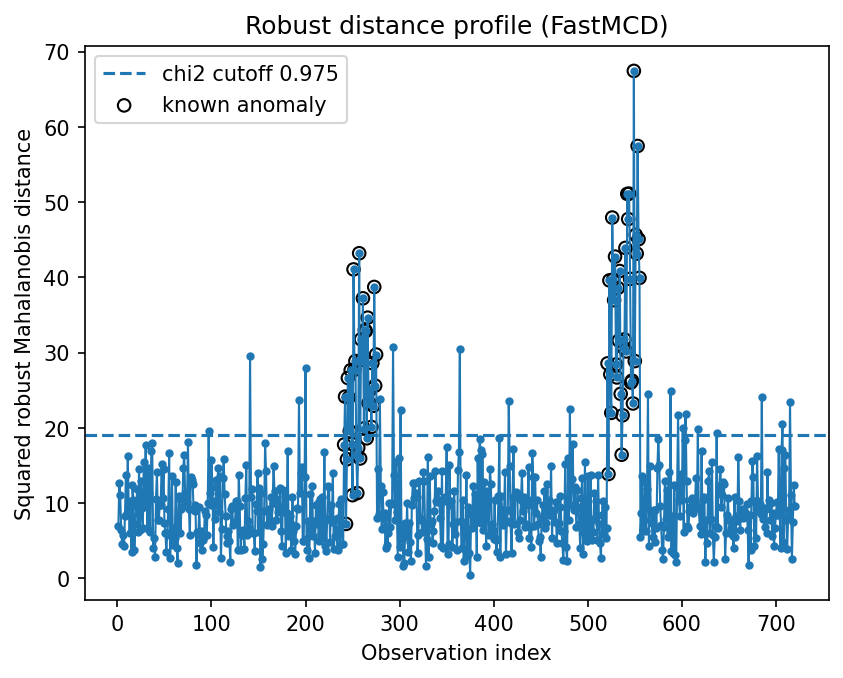
How to read the result
The time profile is the most useful plot. Look for sustained runs above threshold rather than isolated single-point spikes; sustained elevation is usually more actionable for maintenance.
What this does not prove
Production monitoring should include temporal smoothing, operating-mode segmentation, and feedback from maintenance events.