Fraud-style tabular anomaly screening
This example is the small, readable version of the credit-card fraud story. The data mimic ordinary transactions with a small suspicious tail, and robust distances are used as a ranking signal rather than as a black-box classifier.
Result at a glance
FastMCD recovers almost all injected suspicious rows in this synthetic tabular setting: precision and recall are both about 0.986 with 70 flagged rows. The useful point is not just the score; the distance profile gives an interpretable audit trail for why those rows were flagged.
What the data represent
The generator creates transaction-like numerical features with a dominant clean population and a small group of shifted suspicious observations. This matches the regime where global robust covariance is usually appropriate: one main cloud plus separated anomalies.
Why this estimator
FastMCD with a robust-distance threshold. FastMCD is a good first choice when anomalies are expected to sit outside a mostly elliptical normal bulk.
Reproduce the result
python examples/use_case_fraud_screening.py
Output from the run
fraud-style tabular anomaly screening
precision=0.986, recall=0.986, detected=70
radial_kurtosis=5.578, support=1098
saved diagnostics to results/use_cases/fraud
Figures and diagnostics
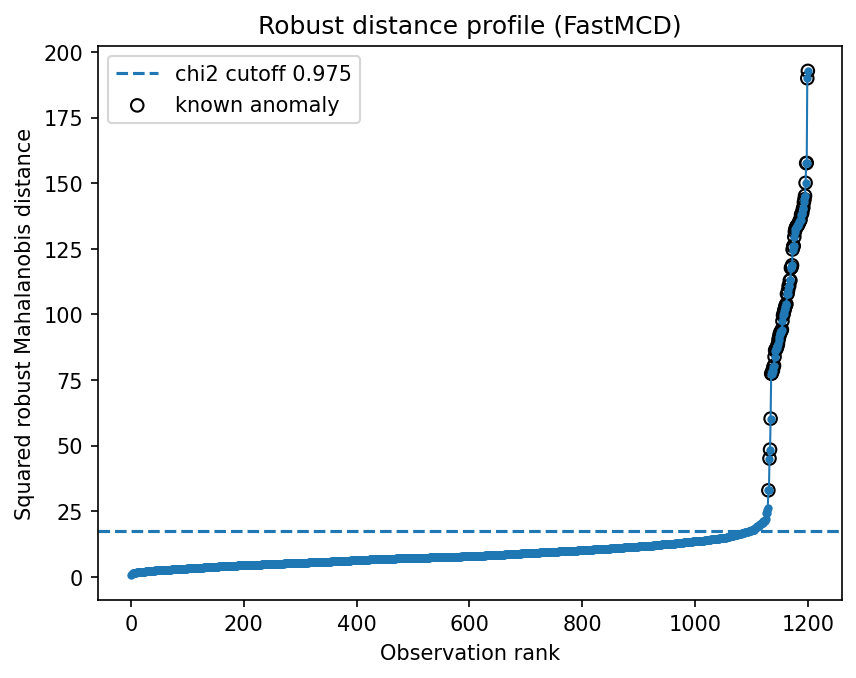
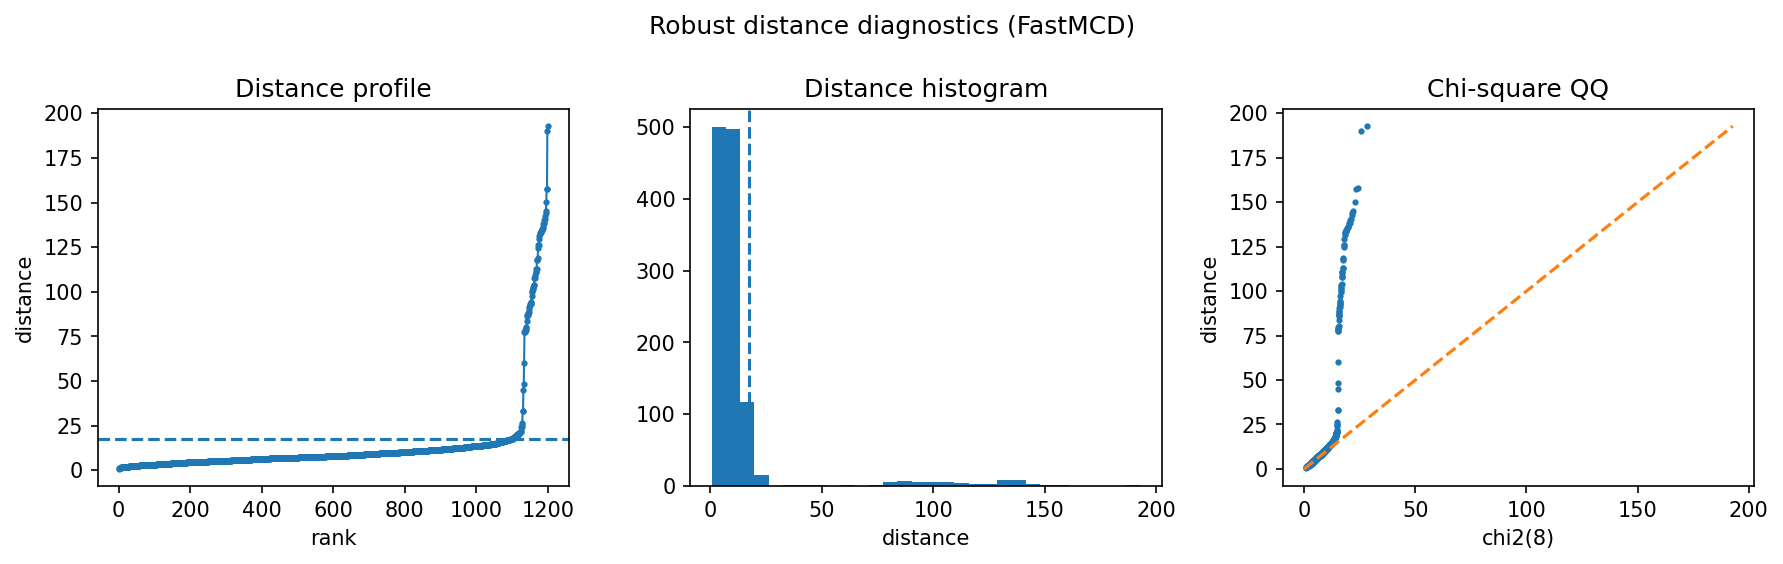
How to read the result
Read the profile from left to right: the flat central region is the normal population and the rising tail is the suspicious queue. A sharp tail is a good sign for review workflows because it means the highest-ranked transactions are meaningfully different from the bulk.
What this does not prove
In real fraud systems, labels, transaction history, and categorical features matter. Treat robustcov scores as a high-signal unsupervised feature or triage layer, not a complete fraud model.