Rolling-window finance anomaly detection
Why this result matters
Single-day outliers are useful, but many financial anomalies are regimes: periods of unusual volatility, correlation, drawdown, or cross-asset behavior. This example converts price data into rolling-window features and scores each window with robust distances.
What the data represent
This documented run uses the same reproducible synthetic price table as the single-day market-stress example. The script forms 20-trading-day windows with a 5-day step, producing 176 windows over 8 assets.
Command
python examples_external/finance_rolling_window_anomaly.py \
  --prices examples_external/data/prices.csv \
  --window 20 \
  --step 5 \
  --outdir results/external/finance_rolling_window
Output from the run
rolling-window finance anomaly detection
method,n_windows,window,step,n_assets,detected_windows,threshold,max_distance,radial_kurtosis
RegularizedCauchy,176,20,5,8,5,152.36606980024123,214.0264973740177,3.9770869272091005
top anomalous windows
rank,start_date,end_date,robust_distance
1,2020-09-03,2020-09-30,214.0264973740177
2,2020-08-27,2020-09-23,195.33176540660608
3,2020-09-10,2020-10-07,186.5938392771558
4,2022-09-01,2022-09-28,171.02390217029944
5,2022-08-25,2022-09-21,158.04725685375985
6,2020-08-20,2020-09-16,142.89742471104356
7,2021-08-05,2021-09-01,139.78449227022205
8,2021-08-12,2021-09-08,139.28137467369586
9,2020-12-03,2020-12-30,138.04402746304234
10,2022-09-08,2022-10-05,136.06979631136875
saved outputs to results/external/finance_rolling_window
Summary metrics
Method |
Windows |
Window length |
Step |
Assets |
Detected windows |
Threshold |
Max distance |
Radial kurtosis |
|---|---|---|---|---|---|---|---|---|
RegularizedCauchy |
176 |
20 |
5 |
8 |
5 |
152.37 |
214.03 |
3.98 |
Plots
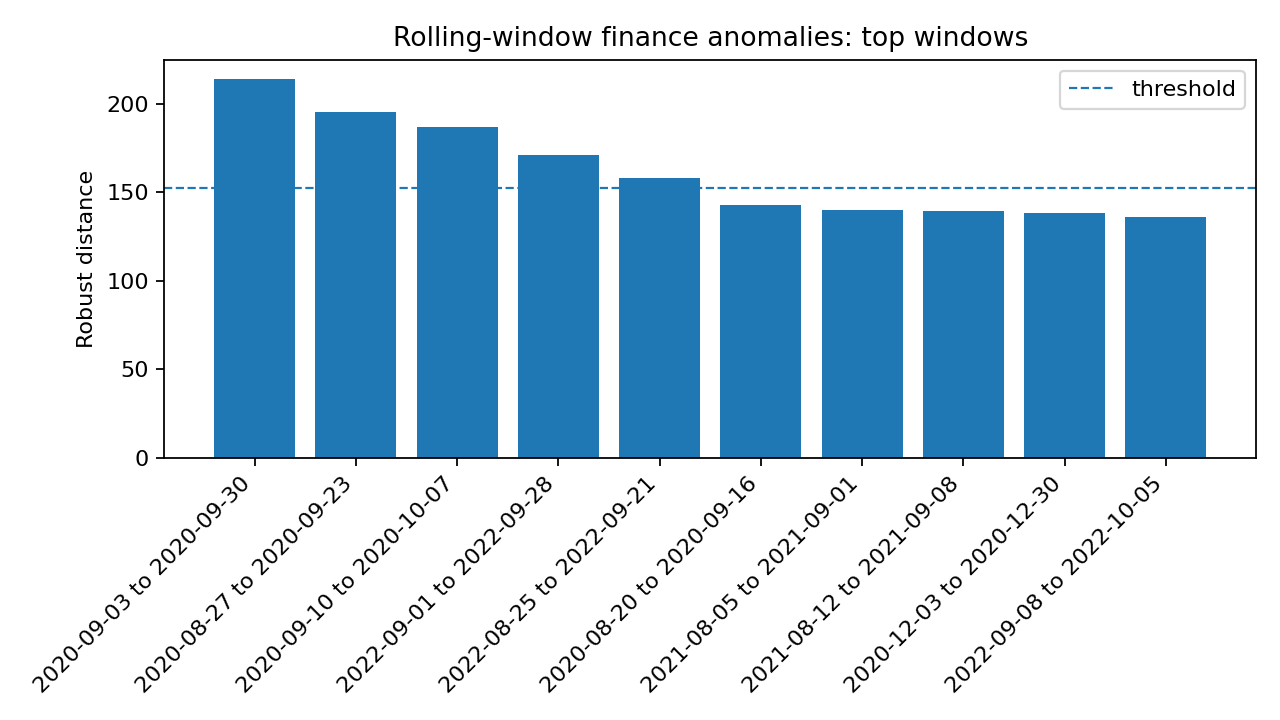
Top anomalous rolling windows. The top three windows overlap the September 2020 stress period, showing that the method detects regimes rather than only isolated points.
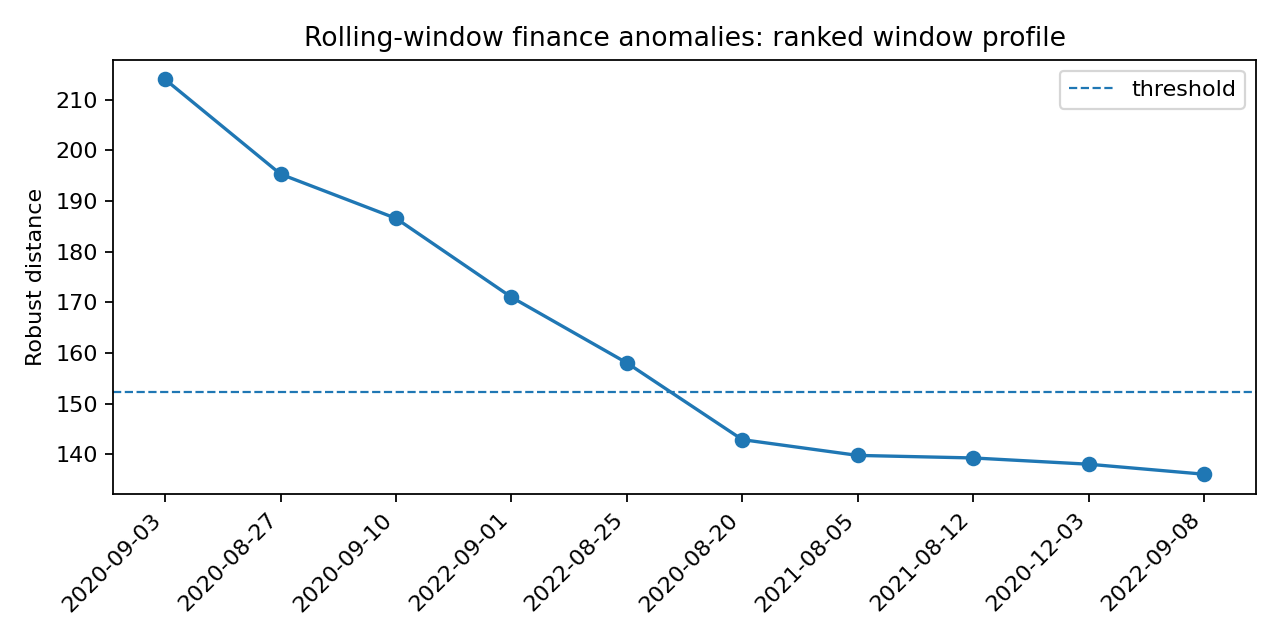
Ranked window-level robust-distance profile. Windows above the threshold are the first regime candidates to inspect.
Interpretation
The rolling example detects 5 windows above the threshold. The top windows are:
Rank |
Start date |
End date |
Robust distance |
|---|---|---|---|
1 |
2020-09-03 |
2020-09-30 |
214.03 |
2 |
2020-08-27 |
2020-09-23 |
195.33 |
3 |
2020-09-10 |
2020-10-07 |
186.59 |
4 |
2022-09-01 |
2022-09-28 |
171.02 |
5 |
2022-08-25 |
2022-09-21 |
158.05 |
The top windows overlap strongly, which is a useful signal in time series: a single anomalous day can be noisy, but repeated high-scoring overlapping windows suggest a persistent regime change.
Why this estimator
Use RegularizedCauchy when windows are high-dimensional or heavy-tailed. If
window features are smoother and closer to elliptical Student-t behavior, try
StudentTScatter as a sensitivity check.
Production notes
For real markets, use rolling-window anomalies as a monitoring layer. Review clusters of high-scoring windows, not just one row at a time. Consider adding volatility, drawdown, correlation, and sector-return features before fitting the robust scatter model.