Network-traffic anomaly simulation
Network monitoring has the same geometry as many industrial anomaly problems: normal flows occupy a stable multivariate region, while attacks or unusual sessions produce atypical combinations of rates, counts, and durations.
Result at a glance
In the lightweight simulation, FastMCD detects the injected anomalous flows with precision and recall equal to 1.000. The robust-distance plot gives a clean separation between normal traffic and the injected tail.
What the data represent
The bundled example is synthetic and intentionally simple. It is meant to show the workflow, not to claim that every network-intrusion dataset is a rare-anomaly problem.
Why this estimator
FastMCD is used when there is a dominant normal traffic regime. For multimodal traffic or many attack classes, cluster-aware diagnostics or supervised baselines may be more appropriate.
Reproduce the result
python examples/use_case_network_traffic.py
Output from the run
network traffic anomaly simulation
precision=1.000, recall=1.000, detected=80
radial_kurtosis=13.409
saved diagnostics to results/use_cases/network
Figures and diagnostics
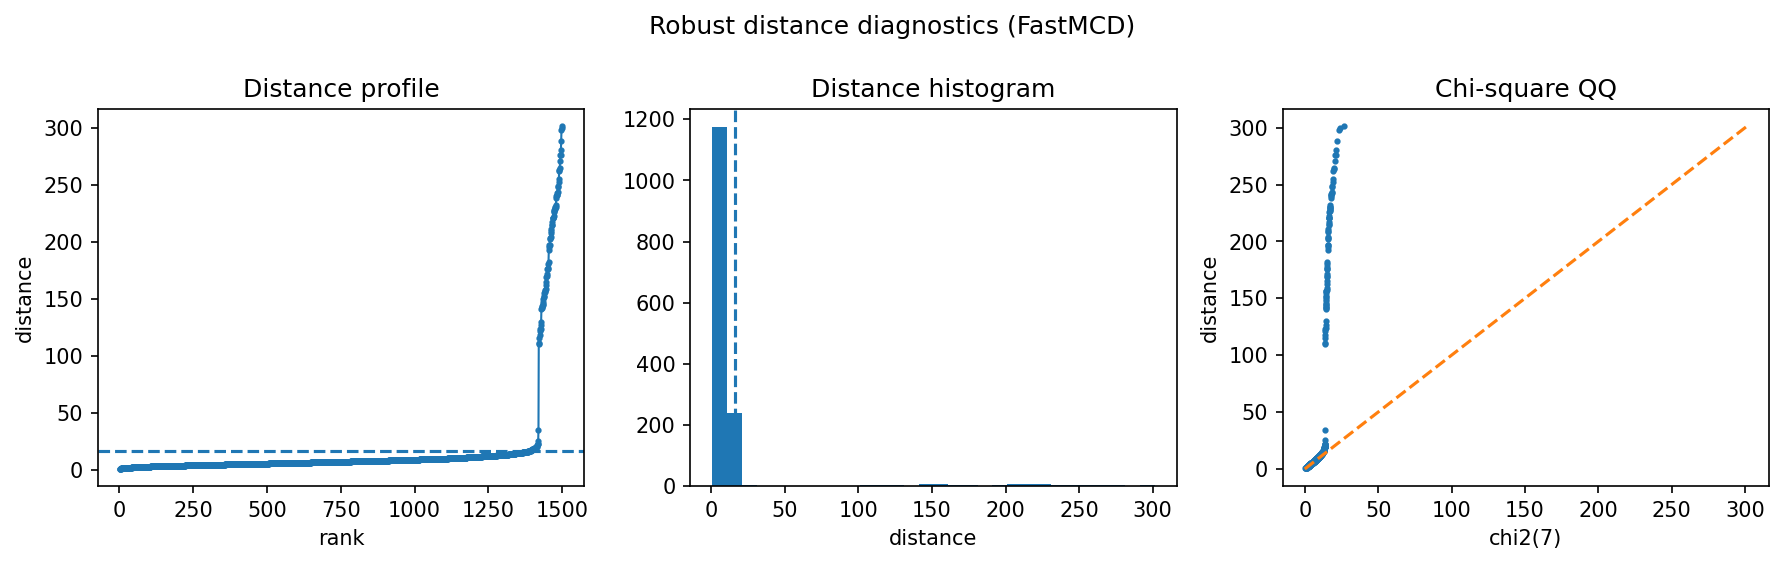
How to read the result
Use the distance panel to inspect whether anomalies form a distinct tail. If normal traffic has several modes, a global covariance model may over-flag legitimate regimes.
What this does not prove
Some popular intrusion datasets have very high attack fractions and are closer to classification than anomaly detection. Those should not be highlighted as rare-anomaly wins.