Quality-control monitoring
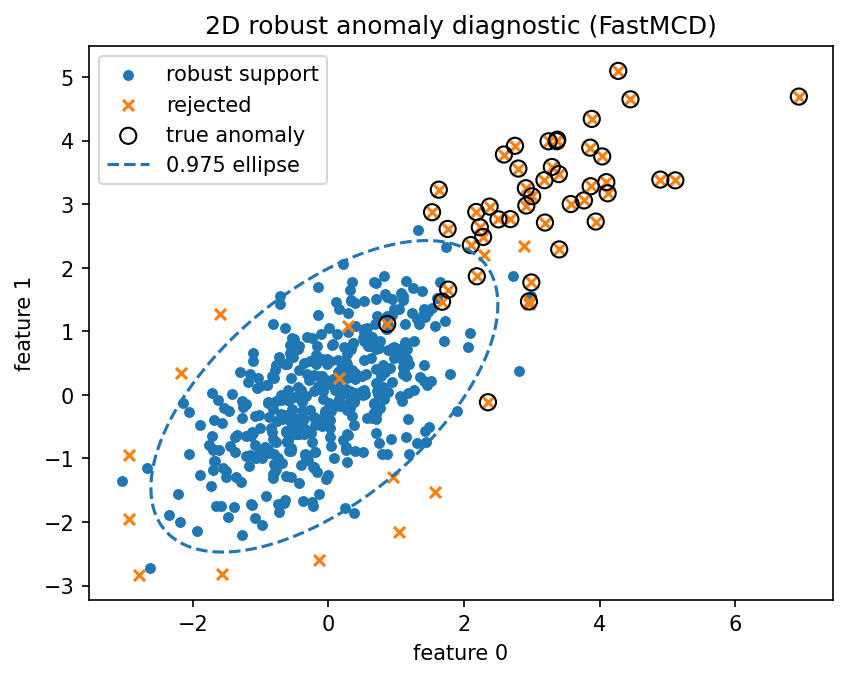
Quality-control problems often involve several measurements per item. A part can look acceptable on every individual measurement but still be unusual in the joint feature space.
Result at a glance
The diagnostic report flags about 13.4% of observations at the chosen threshold and reports heavy-tail/QQ warnings. This is an example where the recommendations are as important as the raw outlier labels.
What the data represent
The example simulates a small multivariate production process with abnormal items and heavy-tailed deviations.
Why this estimator
FastMCD plus DiagnosticReport. The estimator gives robust distances; the report explains whether the threshold and covariance geometry look trustworthy.
Reproduce the result
python examples/use_case_quality_control.py
Output from the run
Robust diagnostic report: FastMCD
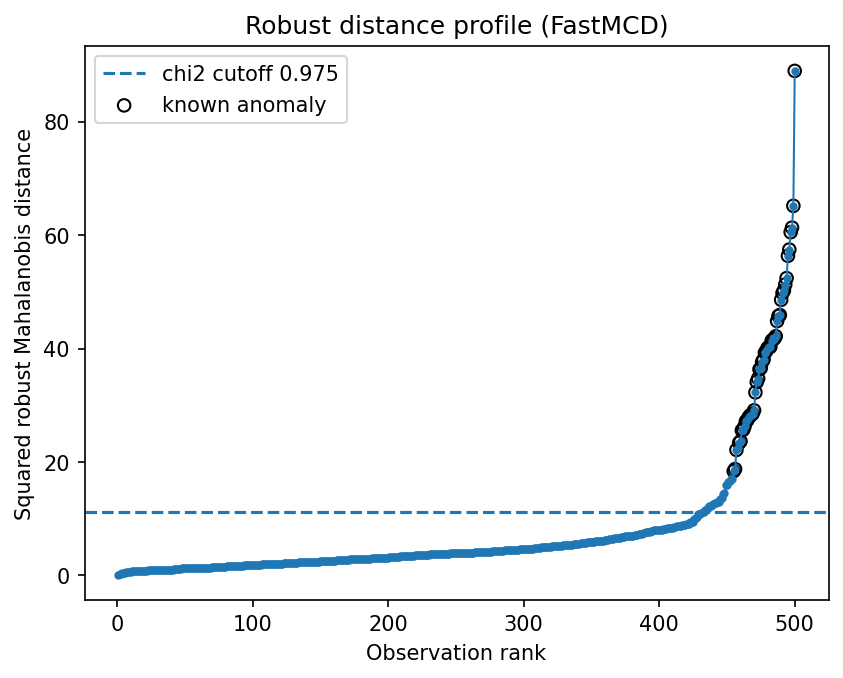
n_samples=500, n_features=4, alpha=0.975
detected_fraction=0.1340, threshold=11.1433
radial_kurtosis=5.2420, qq_tail_deviation=3.8966
condition_number=5.798, max_distance=88.9446
support_fraction=0.8800
effective_support_fraction=0.5040
recommendations:
- Heavy tails detected: compare FastMCD with RegularizedTyler and inspect QQ diagnostics.
- Large detected fraction for the chosen alpha: consider threshold="empirical" or set a contamination prior.
- QQ tail deviation is large: tail behavior is far from Gaussian; use empirical thresholds for anomaly detection.
saved diagnostics to results/use_cases/quality_control
Figures and diagnostics
How to read the result
Start with the recommendations. Here the report says the detected fraction is large and the tail deviates from Gaussian behavior, so empirical thresholds or a contamination prior are preferable to blind chi-square cutoffs.
What this does not prove
Quality-control thresholds should be tied to inspection capacity, scrap cost, and historical defect labels. The robust distance is a ranking signal, not a substitute for process knowledge.