Finance market-stress anomaly detection
Why this result matters
Financial returns are heavy-tailed and correlated across assets. A single large move in one asset is not always a market anomaly, but an unusual cross-asset return vector can indicate stress, regime change, a macro shock, or data-quality problems. Robust covariance gives an interpretable score for each trading day: the robust Mahalanobis distance from the central market regime.
What the data represent
This documented run uses a reproducible synthetic price table with 899 return days and 8 assets. The generator injects stress-like periods so that the script can be run without downloading Yahoo/Kaggle data while still producing a finance-shaped example.
The input format is a CSV with one date column and one numeric price column per asset:
date,SPY,QQQ,IWM,TLT,GLD,EFA,EEM,HYG
2020-01-01,100.0,...
Command
python examples_external/finance_market_stress.py \
  --prices examples_external/data/prices.csv \
  --outdir results/external/finance_market_stress
Output from the run
finance market-stress anomaly detection
method,n_days,n_assets,alpha,detected_days,threshold,max_distance,median_distance,radial_kurtosis,condition_number
RegularizedCauchy,899,8,0.975,23,95.79757169861077,251.5634271621798,7.344121400847285,2.815129834185989,6.066016648802037
top stress days
rank,date,robust_distance
1,2020-09-11,251.5634271621798
2,2020-09-16,232.6356115298036
3,2020-09-17,217.49733699014894
4,2022-03-03,204.18076327111973
5,2022-09-14,159.49903060794182
6,2020-09-18,157.19605603272385
7,2021-08-18,156.86350751922998
8,2022-09-07,155.85245060739706
9,2021-08-16,154.16973914961375
10,2020-09-22,154.1142504102232
saved outputs to results/external/finance_market_stress
Summary metrics
Method |
Days |
Assets |
Alpha |
Detected days |
Threshold |
Max distance |
Median distance |
Radial kurtosis |
Condition number |
|---|---|---|---|---|---|---|---|---|---|
RegularizedCauchy |
899 |
8 |
0.975 |
23 |
95.80 |
251.56 |
7.34 |
2.82 |
6.07 |
Plots
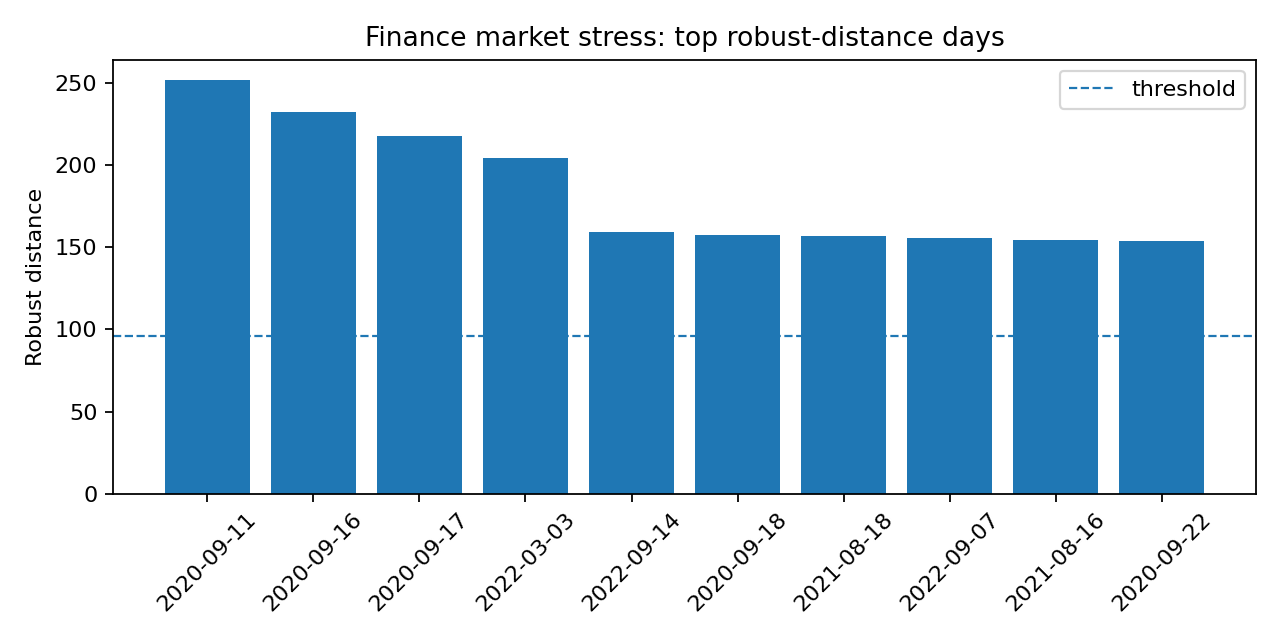
Top ranked robust-distance days. The dashed line is the detection threshold. The largest detected day is 2020-09-11 with robust distance 251.56.
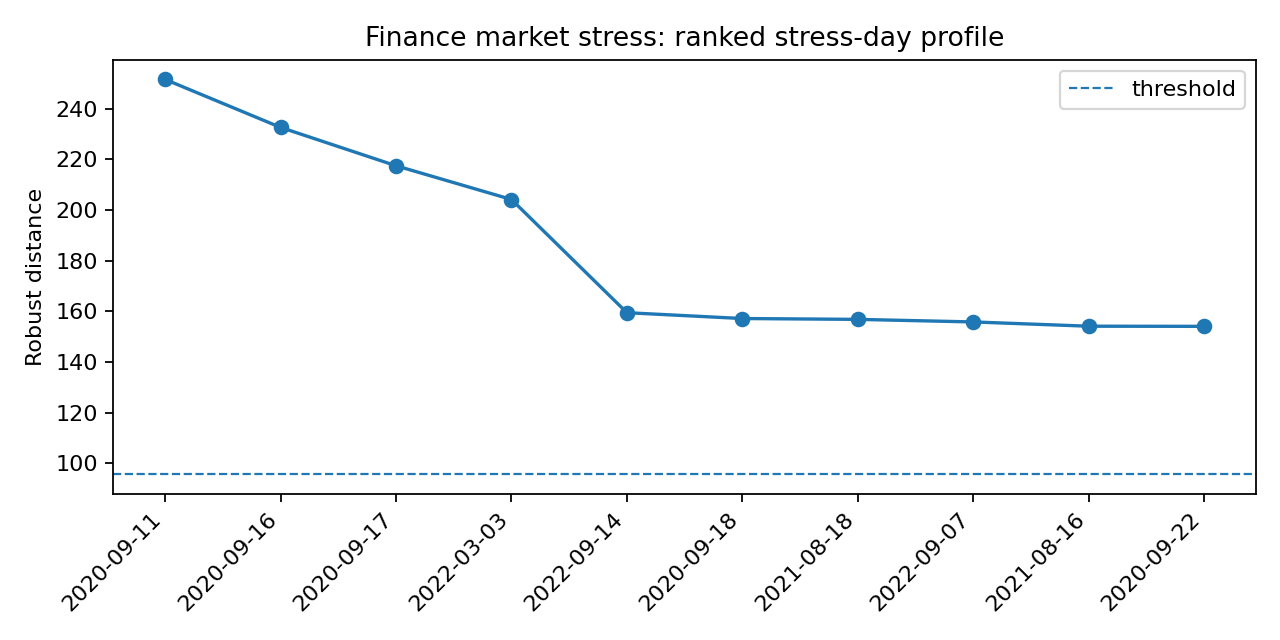
Ranked stress-day profile for the top detected dates. A finance user can inspect the dates directly and compare them against known market events or injected stress periods.
Interpretation
The estimator flags 23 of 899 days, about 2.6%, which is consistent with the
alpha=0.975 threshold. The condition number is low (about 6.1), so the
robust covariance estimate is numerically stable. The radial kurtosis is not
extreme, meaning the robust fit has absorbed the central heavy-tailed behavior
without becoming ill-conditioned.
The top stress days cluster around stress-like periods, especially September
2020 and September 2022 in this synthetic run. This makes the result easy to
explain: robustcov is not only returning a score, it is producing a ranked
list of market days for review.
Why this estimator
Start with RegularizedCauchy for finance returns because it combines strong
radial downweighting with shrinkage. Use StudentTScatter as a smoother
heavy-tail sensitivity check, and AutoRobustScatter if the data regime is
unclear.
Production notes
For real data, run the same script on ETF or stock prices. Review top days against market calendars, corporate actions, missing prices, and known stress events. For portfolio use, robust distances should complement risk models; they should not be treated as trading signals without validation.